End-to-End Retail Data Platform on GCP
From two raw CSV files to a live analytics dashboard
Project Overview
UK giftware retailer, production-grade analytics platform built from scratch
Part 1
Data Pipeline
Business Problem
UK retailer, 38 countries, raw CSV data, not clean, not structured, not usable for analytics
| InvoiceNo | StockCode | Quantity | InvoiceDate | CustomerID |
|---|---|---|---|---|
| 536365 | 85123A | 6 | 12/1/10 8:26 | 17850 |
| C536379 | D | -1 | 12/1/10 9:41 | 14527 |
| 536370 | POST | 3 | 12/1/10 8:45 | 12583 |
- ✗
C-prefixed invoices: cancellations with negative quantities - ✗
POST,Dstock codes: non-product rows - ✗ Dates stored as text, two different formats in the same column
- ✗ Same
StockCodewith different descriptions and prices
Four Questions They Couldn't Answer
- Which countries generate the most revenue?
- Which products sell the most?
- How does revenue trend month over month?
- Who are our highest-value customers?
The Approach
Raw files must be loaded, then cleaned, structured, and modelled before they can answer anything
Load: drop them into BigQuery as-is
Transform: clean and model inside the warehouse
Unlike ETL, transformation happens after loading, leveraging the warehouse's compute power.
It is the T in ELT.
Each model is a
.sql file. dbt compiles, runs, and tests them against the warehouse in the right order.
dbt Transformations
| Model | Problem | Solution |
|---|---|---|
dim_datetime |
Dates as text, two formats | PARSE_DATETIME selected by string length |
dim_product |
StockCode not unique |
Surrogate key = hash(code + desc + price) |
dim_customer |
No ISO codes, duplicates | Deduplicate + join country reference |
fct_invoices |
Returns, noise, no totals | Filter Qty > 0 + compute Qty × Price |
541,909 raw rows → 397,884 validated sale facts
·
Tests: unique, not_null, relationships
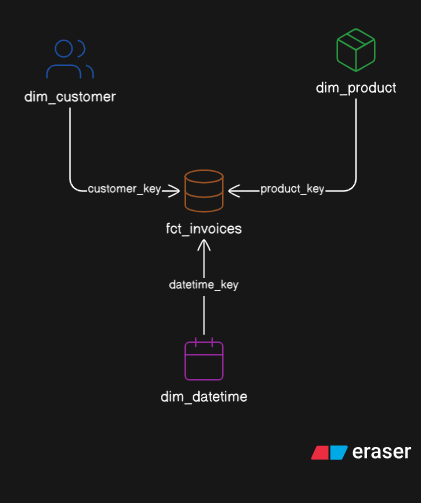
Star Schema
A modelling pattern where one central fact table is surrounded by dimension tables, like a star. Optimised for analytical queries.
→ fct_invoices (397,884 rows)
Report Layer
Pre-aggregated for Looker Studio, one model per business question
report_customer_invoices
→ revenue, invoice count, top 10
report_product_invoices
→ total quantity sold, top 10
report_year_invoices
→ invoice count, total revenue
Part 2
Infrastructure
GCP Architecture
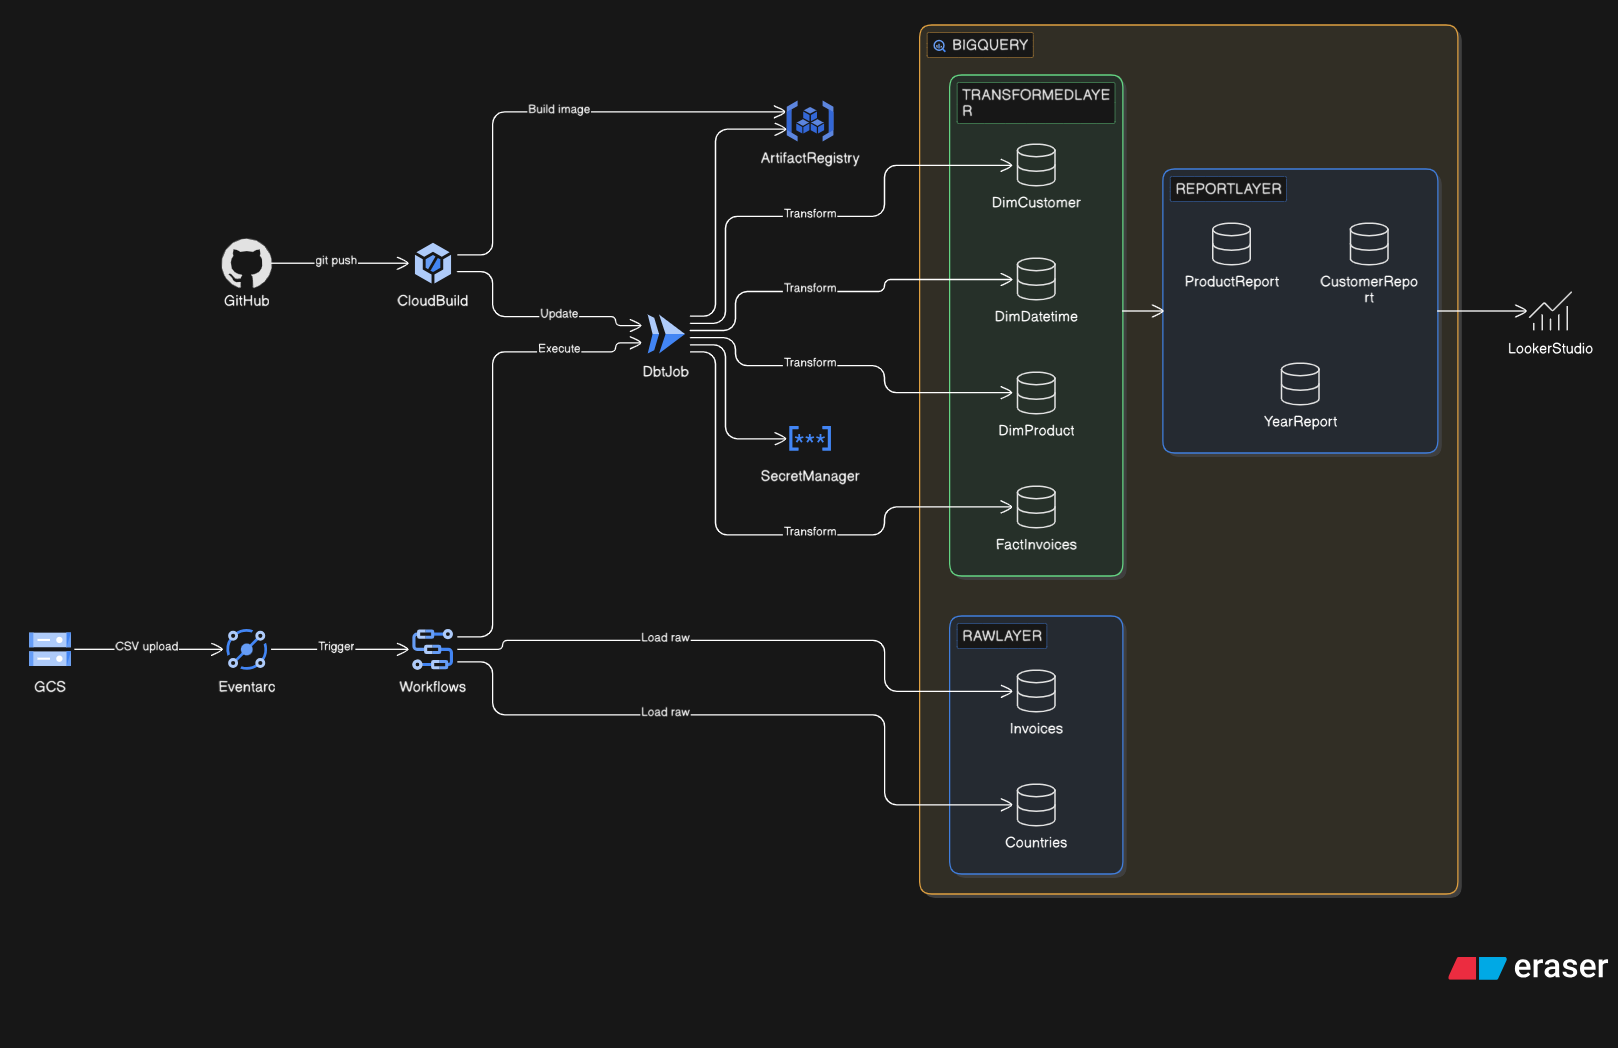
GCP Components
| Component | Role |
|---|---|
| GCS | Raw CSV file storage, where the data journey begins |
| Eventarc | Fires on object.finalized: zero lag, reacts on file landing |
| Cloud Workflows | Orchestrates: load CSVs first → then trigger dbt |
| BigQuery | 3 datasets: raw, transform, report |
| Cloud Run Job | Runs dbt Docker image on demand, stateless, exits when done |
| Secret Manager | BigQuery credentials, no passwords hardcoded |
| Artifact Registry | Stores the dbt Docker image |
| Cloud Build | CI/CD: rebuilds and pushes the dbt image on git push |
Terraform
Infrastructure as Code: every GCP resource in version-controlled files
modules/platform
modules/pipeline
modules/observability
terraform apply→ creates every resource from scratch- Reproducible: deploy identically to dev, staging, prod
- Every IAM permission is a line of code, not a console click
Part 3
BI Layer
Answering the Business Questions
Looker Studio → BigQuery → report dataset · View live dashboard
report_customer_invoices · Bar chartreport_product_invoices · Bar chartreport_year_invoices · Line chartraw_invoice · Horizontal bar by revenueExpected: UK dominates · Q4 spike (Oct to Dec) · small decorative items drive volume
From two CSV files and four unanswered questions
to a fully automated, tested, event-driven analytics platform.
Zero manual steps between data landing and dashboard updating.